We screened 10,000 companies for Trump policy exposure. Here's what the data shows.

Francisco Gómez, our VP and Manager of Applied Intelligence walks us through how a single batch job replaces weeks of analyst work and surfaces risks hiding in plain sight. The full notebook, including the batch API client and post-processing code, is available in the bigdata-cookbook repository on GitHub.
Last quarter, the Trump administration halted five East Coast offshore wind projects in a single announcement. Dominion Energy's stock dropped almost 5% the same day. Constellation Energy fell 10%. The signal was loud, but only if you were watching those names.
Now imagine you're responsible for a global equity portfolio. Not 50 names. Not 500. Ten thousand. How do you systematically screen which companies are exposed to a policy shift, across sectors, countries, and supply chains, before the market reprices?
We ran the experiment. Using Bigdata.com's Batch Search API, we screened the entire Global All-Cap universe (10,000 publicly listed companies) against a single question: "How is this company affected by the Trump administration's policies?" One batch job. No client-side infrastructure. The results came back with scored, source-linked evidence for every company in the universe.
Here's what we found, and why this changes how systematic teams can approach thematic and policy-risk screening.
1,847 companies flagged. 19% of the global universe
That's not a handful of obvious names. Nearly one in five companies in the top 10,000 globally had document-level evidence linking them to Trump administration policy effects over the trailing six months.
Each company received a composite score: the sum of (sentiment × relevance) across all matched document chunks. This captures both the volume of coverage and its directional intensity. A company mentioned in ten highly relevant, deeply negative articles scores very differently from one with a single neutral mention.
The five most negatively exposed names:
Dominion Energy led the list, unsurprisingly given the wind project halts. But the screening also surfaced names that wouldn't have appeared on a typical watchlist. These were companies where policy exposure was building quietly across regulatory filings, local news, and earnings call transcripts rather than making front-page headlines.
The five most positively exposed names reflected sectors perceived to benefit from deregulation or domestic industrial policy, the kind of positioning signal a quantamental PM would want to cross-reference against factor exposures.
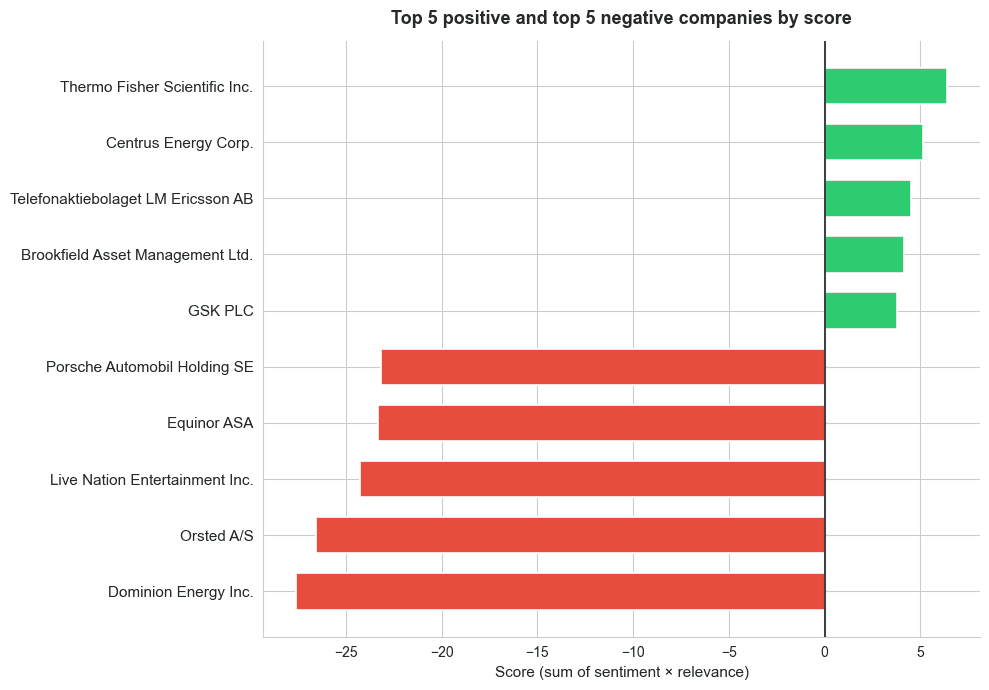
[Figure 1: Horizontal bar chart showing the top 5 positive (green) and top 5 negative (red) companies by composite score.]
Drill down: what's actually driving the scores?
Aggregate scores are useful for ranking, but the investment decision lives in the evidence. Every score traces back to specific document chunks, the actual sentences that connect a company to the policy theme.
For Dominion Energy, the top-ranked chunks told a clear, consistent story. The administration ordered a halt to construction on the Coastal Virginia Offshore Wind project, citing national security concerns. The company went to court to fight the stop-work order, claiming millions in daily losses. A federal judge issued a preliminary injunction. Each of these developments was captured, timestamped, and scored individually.
Here's what the top chunks look like for Dominion Energy, the most negatively scored company in the screen:
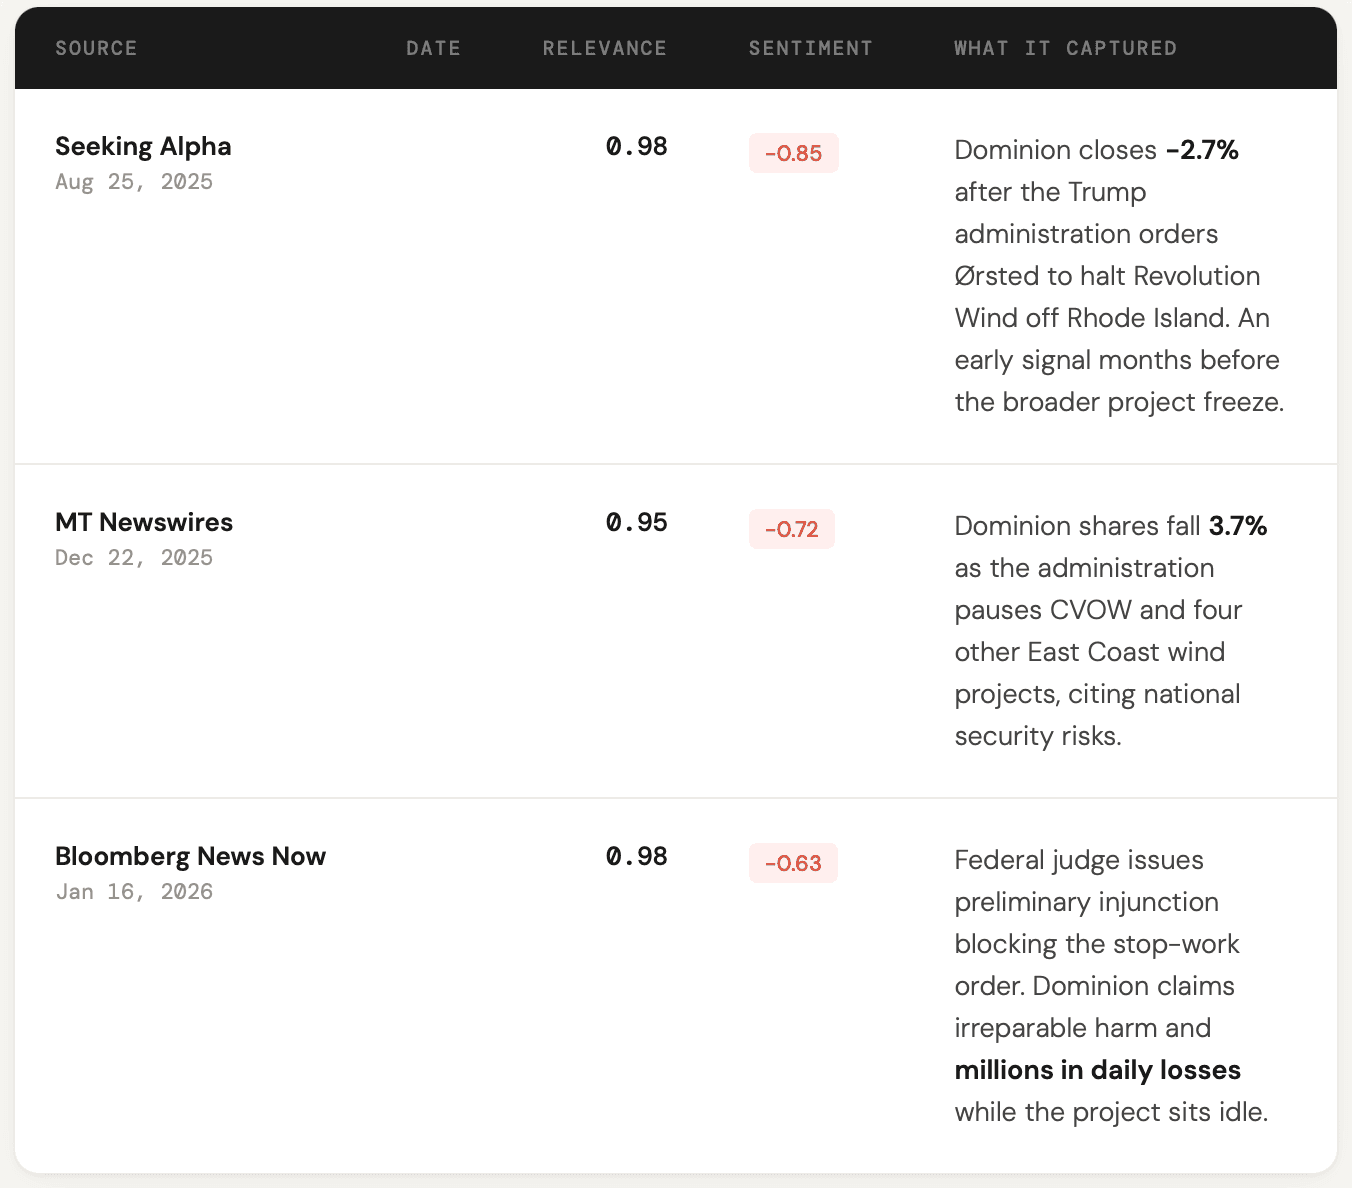
Three chunks from three different sources, spanning five months and capturing different stages of the same policy story: early contagion from a related project, the direct halt, and the legal fight that followed. This is the kind of provenance that matters for compliance review and investment committee discussions. Not "our model says the stock is at risk" but "here are the source documents, ranked by relevance, with sentiment scored at the chunk level."
The real power: Bottom-up macro in one heatmap
Screening individual companies is valuable. But aggregating those entity-level scores up to sector × country creates something much more powerful. You get a bottom-up macro indicator built from document evidence, not survey data or pre-aggregated statistics.
We built a heatmap across all sectors and a G12 country selection. Each cell represents the total policy-exposure score for that sector-country combination.

[Figure 2: Sector × country heatmap. Blue = negative exposure, white = neutral, red = positive.]
What emerged was a map of where Trump policy risk concentrates globally, and where the market may be underpricing or overpricing that exposure. Energy and industrials in certain geographies showed deep negative scores. Financials in others showed surprising resilience. These aren't predictions. They're systematic summaries of what the world's financial media, filings, and transcripts are actually saying, grounded in thousands of source documents.
For a macro strategist, this is a leading indicator. For a risk analyst, it's an exposure map. For a PM, it's an idea generation engine.
What this means for your workflow
If you're running a systematic or quantamental process, the implications are straightforward.
Before: Thematic screening at portfolio scale meant building custom NLP pipelines, managing API rate limits across thousands of requests, handling retries and deduplication, and paying for compute you only use quarterly. Most teams either scope down the universe to something manageable or don't do the screening at all.
After: One file upload. One download. The Batch Search API handles the orchestration, rate limiting, and resource management server-side. You spend your time on the analysis, not the plumbing.
The same workflow applies beyond equities and beyond this particular policy topic. Swap in commodity entities to screen how tariff announcements affect the full commodity complex. Replace the topic with central-bank rhetoric to score sentiment across G10 currencies. Screen thousands of suppliers for concentration risk before disruptions propagate. The batch infrastructure doesn't care what you're screening for. It cares that you can screen everything at once.
Under the hood (for quant devs who want the details)
The technical setup is intentionally simple. The universe loads from a CSV. Queries are built programmatically (10 entities per query, 1,000 queries total) and submitted as a single JSONL file. Entity resolution uses RavenPack's knowledge graph (7M+ entities), so you're matching against canonical identifiers, not hoping your string-matching holds up across languages and transliterations.
A few design choices worth noting for practitioners:
Co-mention bias control. A chunk that mentions both Company A and Company B could inflate scores for both. The post-processing assigns each chunk only to entities that were explicitly queried in that batch line and detected in the chunk. This keeps scores clean.
Reranker thresholds. We used a threshold of 0.7, which favors precision over recall. For exploratory screens you might lower it. For compliance or risk workflows, add an LLM verification layer in post-processing.
Score aggregation. Summing sentiment × relevance (rather than averaging) means companies with more coverage get larger absolute scores. This is deliberate. For a screening use case, volume of relevant negative coverage is the signal. Normalizing by coverage count is a valid extension if you want to isolate intensity from attention.
The full notebook, including the batch API client and post-processing code, is available in the bigdata-cookbook repository on GitHub.
Try it on your universe
The Batch Search API is available to enterprise customers via the Bigdata.com platform. If you're running a systematic process and want to screen your actual portfolio universe against a live theme (tariff exposure, AI capex, election risk, central-bank sentiment) request API access and we'll walk you through the setup.
For quant teams already on the platform, the cookbook notebook runs end-to-end. Clone the repo, point it at your universe CSV, and change the topic string. You'll have scored, source-linked results for every name in your book within hours, not weeks.
The analysis in this post used the Bigdata.com Batch Search API and RavenPack knowledge graph. All entity scores are derived from publicly available documents including news articles, earnings call transcripts, and regulatory filings. This is not investment advice.


