Watchlists become powerful interactive dashboards where every datapoint is an entry point for deeper understanding.
By
Raul Balanzino, VP of Product
·

This month, we’re rolling out a major upgrade to Watchlists: Data Views.
At Bigdata.com, we turn static financial data into intelligent, conversational insights that drive confident decisions. With Data Views, we’re taking this a big step further by making Watchlists a powerful interactive dashboard where every datapoint becomes an entry point for deeper understanding.
What makes Data Views different?
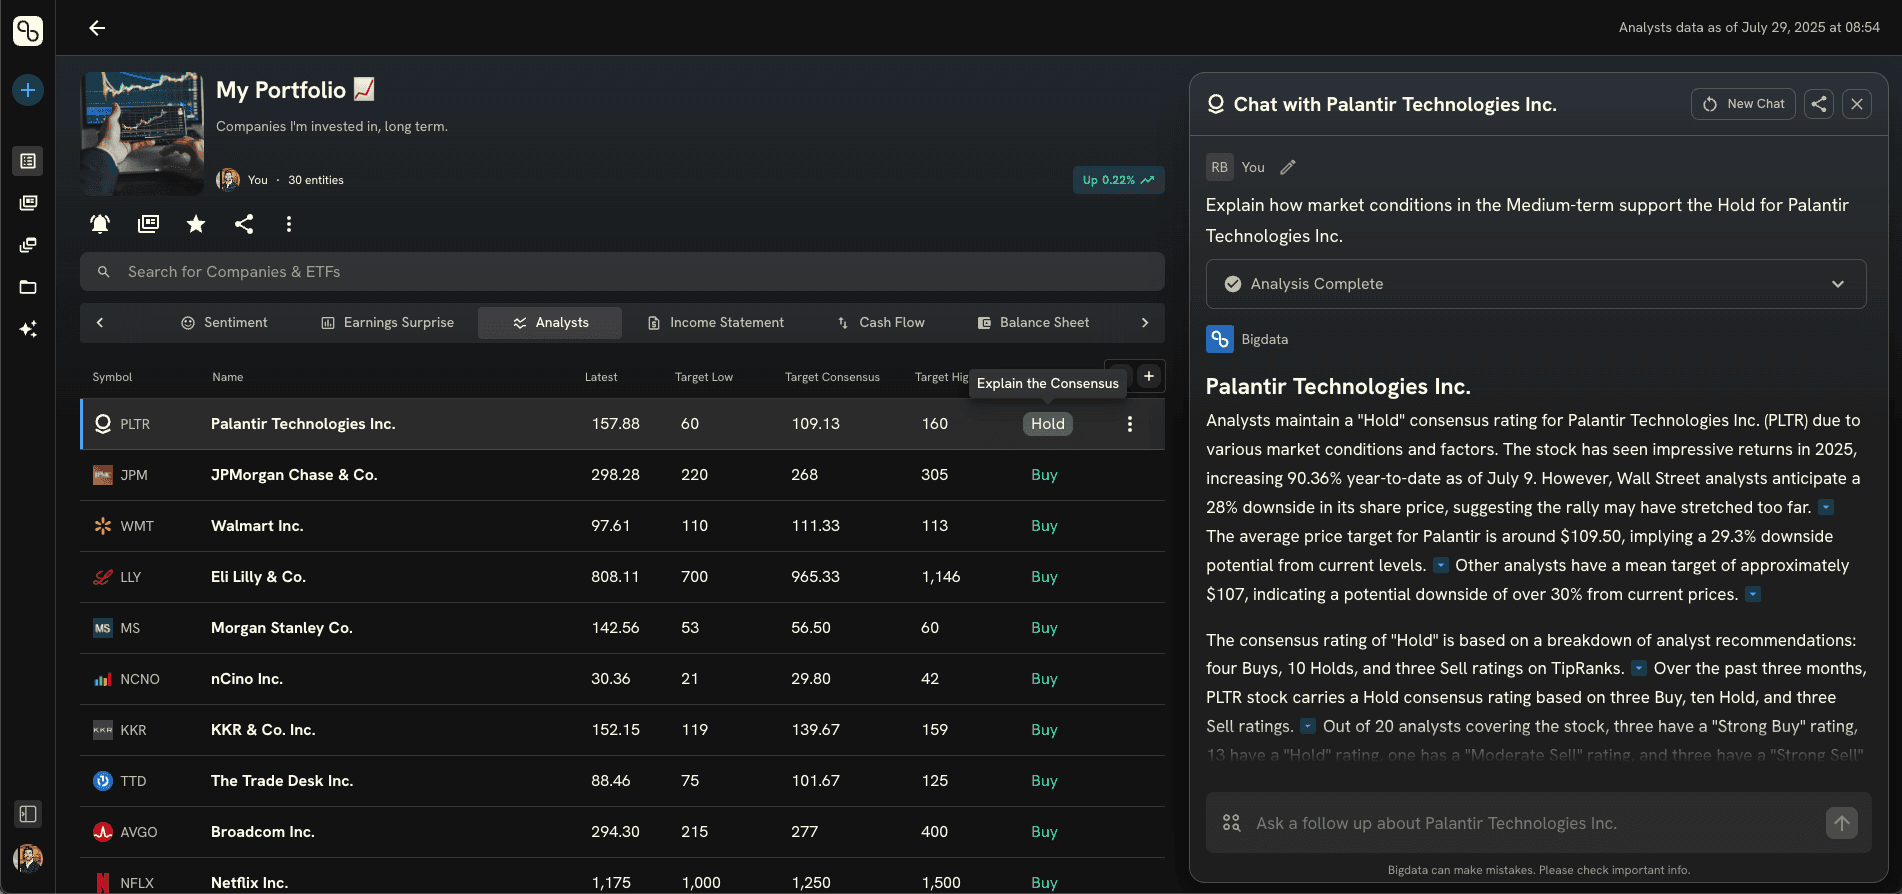
Most finance apps give you static tables or metrics - rows of numbers with no explanation behind them. The new Watchlists with Data Views break that limitation. Every value you see is clickable and explainable. When you click on a metric, whether it’s an earnings surprise, a sentiment spike, or an analyst target change, Bigdata instantly shows you more context and the underlying drivers behind them.
This innovation transforms Watchlists from passive lists into dynamic, interactive views where you can move seamlessly from seeing a key number to understanding exactly why it’s happening, without context switching.
Available Data Views in Watchlists
These are the Data Views now available for the companies in your watchlists:
Price: Latest price, % change over time frames
Sentiment: Daily Sentiment, Sentiment Pressure, Abnormal News Volume
And for Pro Subscribers:
Earnings Surprise: EPS Actual, EPS Estimated, EPS Surprise %, Revenue Actual, Revenue Estimated, Revenue Surprise %
Analyst Ratings: Target High, Low, Consensus, Overall Consensus
Income Statement: Revenue, Cost of Revenue, Gross Profit, Net Income, EBITDA
Balance Sheet: Total Assets, Liabilities, Equity, Debt
Cash Flow: Free Cash Flow, CapEx, Operating Cash Flow, Dividends, Dividend Yield
Valuation: Enterprise Value (TTM), P/E, P/B, P/S ratios
Returns: ROA, Operating ROA, RO Tangible Assets, ROE
Per Share: Revenue/Share, Earnings/Share, Cash/Share, Book Value/Share
Liquidity: Current, Quick, Cash, Solvency ratios
Margins: Gross, Operating, EBIT, Net margins
Capital Spending: Capex/Cash Flow, Capex/Depreciation, Capex/Sales, R&D Intensity
Operational Efficiency: Inventory, Receivables, Payables, Fixed Asset turnover
Income Quality: Income Quality, Tax Burden, Interest Burden, Effective Tax Rate
What’s next?
We will be adding more Data Views to Watchlists, including hiring insights, private company and ETF data, and interactive Company Tearsheets, making your research experience even more actionable.
Sign in to Bigdata.com to explore your upgraded watchlists with Data Views.


